

Morphological Studies of Rome
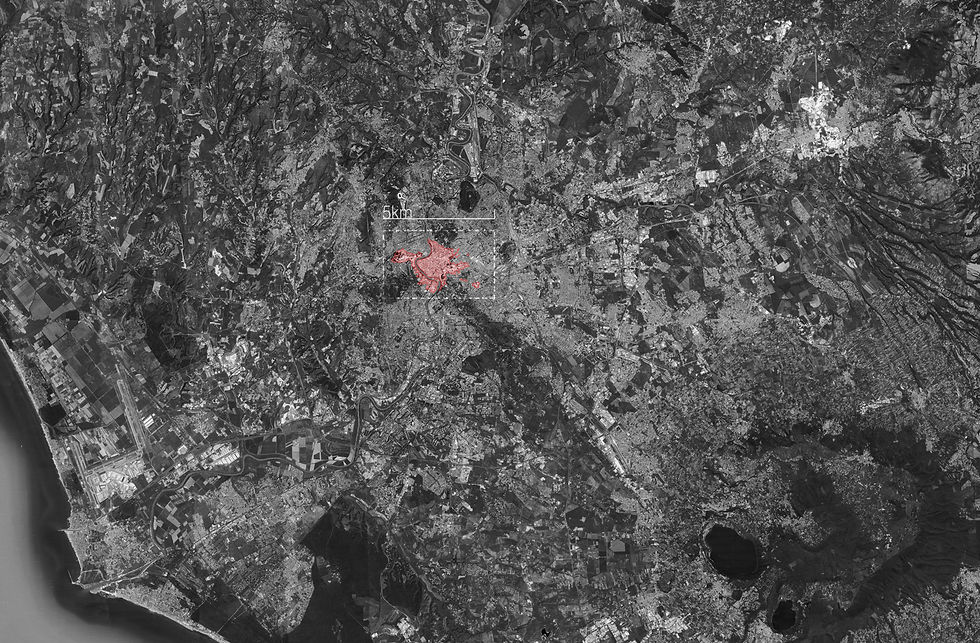
The maps show the morphological growth of the city of Rome in 30s steps from 1870 to 2020.
It can be seen that the urban organism is spreading like a tumour in the landscape and that the two forces of agriculture and urban structure collide in tectonic shifts, creating cavities that have created a unique urban porosity in Rome.


Studies of Rome's City Organism
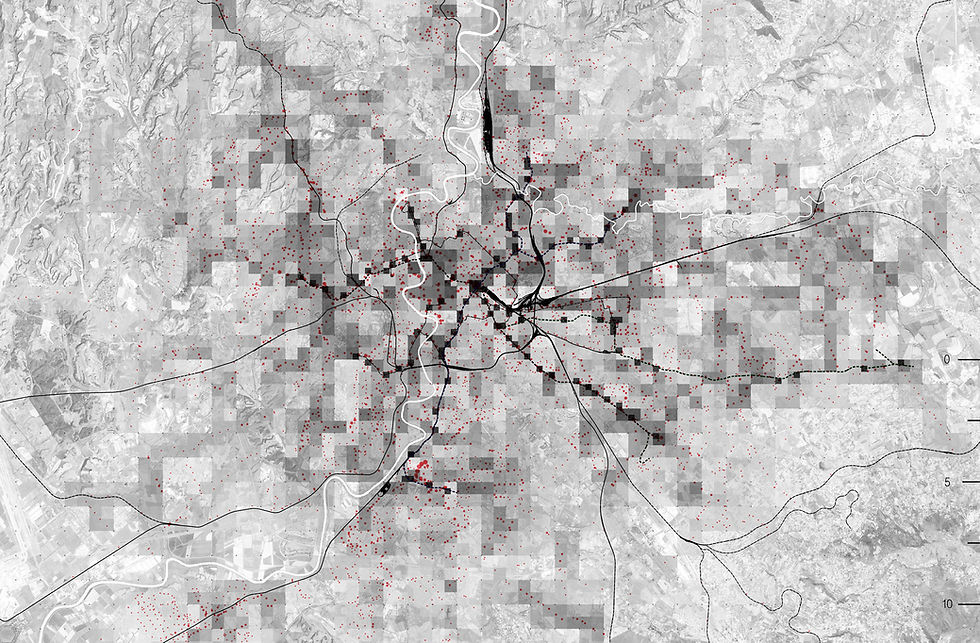
In the maps shown on the right the city of Rome is shown in different ways, it is tried to convey in cartographic style how the city works. The analyses have been carried out illustrating and understanding the imbalance and heterogeneous functioning of Rome.
First the public transport system; the darker the quadrant, the better the zone is connected to the public transport system, therefore ETFS data of the ATAC (roman public transport company) was analysed. The map is an synthesis from the stations, the frequences, routes and travel and stoptimes of all roman ‘mezzi‘ put together.
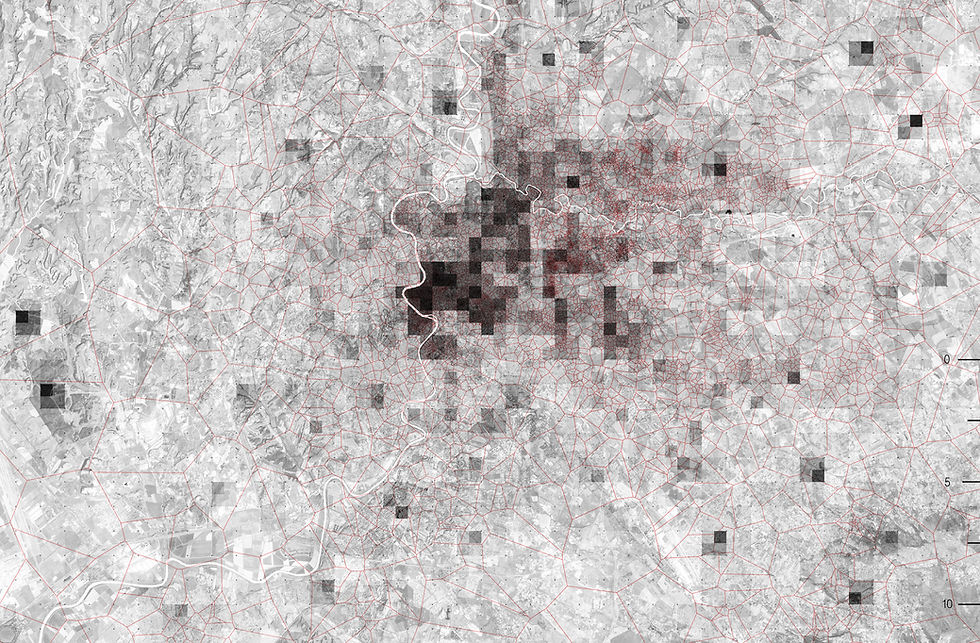
The second map shows where the Romans work, the more jobs are located in a quadrant, the higher the density of the given jobs.
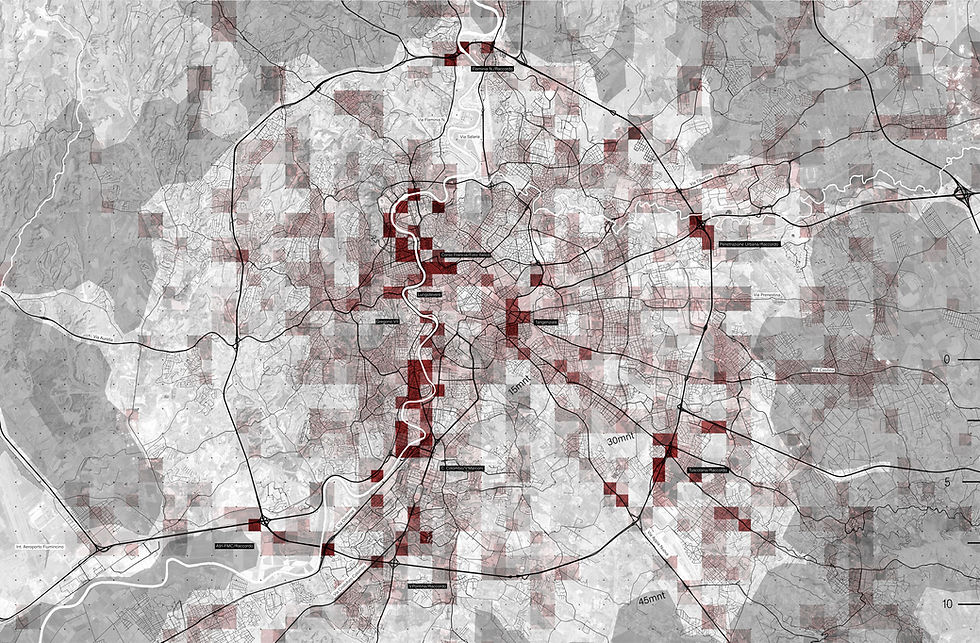
In the third of this project is the map the population density in the Roman built-up area is shown and there is also a map of the average traffic situation in the city.
If you put all these maps on top of each other and interpret them in your mind, you will quickly understand that it is also proven from an analytical point of view that Romans claim their city simply doesn‘t work in an homogeneous way. The roman city organism developed in a uncontrolled manner, an ongoing battle between rural an urban tectonical movements split the city and this unique, living, tumouros organism was created.
From Rom. eine Hommage
Diplom Thesis @ University of Innsbruck